Quantcast
Channel: Viget Articles
Viewing all 1271 articles
Browse latest View live

Boulder Project Manager Happy Hour May 14, 2013

$
0
0

About a month ago Becky put together the Inaugural Boulder Project Management Meetup. Based on the excitement about the event, we’re doing another one! Join us next Tuesday night, May 14th, 6 PM, at Fate Brewing Company for the next Boulder Project Manager Happy Hour.

What might you expect? Besides great beer and company, you’ll enjoy -- and hopefully contribute to -- valuable conversation with your peers as we build a community of project managers in the Boulder area.

One of my favorite topics from our last Meetup was the role project managers play in driving innovation. We all face the challenge of supporting teams who need to grok a client’s business goals, work towards a strategic vision, but stay mindful of time and budgets. We discussed how innovation in our teams’ work, and in our approach to project management, can address (and sometimes complicate) these challenges. The conversation has stuck with me in the last month and informed some of my day-to-day work here at Viget.

On the 14th, we’ll be talking about the format of these events moving forward. Please join us now so your voice is heard. We welcome your input on how this group can best serve the needs and interests of our community!

RSVP here.


The Neo Fallacy: How Our Mental Model of Developers Leads to Bad Bug Reports

$
0
0

In two previous posts about writing better bug reports, I've detailed the information developers need to be able to reproduce — and hence diagnose and fix — bugs. Since then, an unstated assumption in both posts has been nagging at me: that developers must be able to reproduce a bug in order to diagnose and fix it.

To a developer, this is not an assumption — it's truth, and obvious. But to non-developers, the necessity of reproducibility is not obvious. If it were, devs wouldn't see so many bug reports that say little more than "A vague thing vaguely happened — fix it!!!"

I think this disconnect is the primary cause of frustrating-to-devs bug reports. If we can better understand the reason for the disconnect, maybe it'll be easier to convince non-devs of the necessity of reproducibility. 

So what causes this disconnect? Here's my theory:

I believe that most non-developers think developers are like Neo in The Matrix: that devs can see all parts of an app simultaneously at all times, like Neo's living-ASCII-art view of the Matrix itself. That devs are omniscient, omnipotent beings in regard to an app. I've come to think of this mental model as the Neo Fallacy.

If pressed, I don't think we could say how we think developers do this. (Optic fiber running from servers to devs' brain stems? Magic emanating from the bowels of 4chan? Google Glass?) But I can't think of a better explanation for why so many of us assume devs can figure out a bug from so little information.

Returning to theory No. 1, I asked some Viget developers why reproducibility is so important. Some of their answers:

  • "So we can hopefully write a failing test first, and then have one in place to prevent future regressions"
  • "To confirm it's an actual bug"
  • "To know when we've fixed it"
  • "To be able to investigate the issue deeply"
  • "So we don't waste our super valuable time"

All make sense. But those answers are beside the point to someone operating under the Neo Fallacy: "Fine, but why do you need to reproduce the bug to achieve all those things? Can't you just 'see' what's happening?"

Here's an answer that I hope helps reframe the way we think about developers:

Developers are not Neo. Yes, they have superpowers when it comes to writing code. But they're mere mortals when it comes to knowing what's happening in an app in real time. They're not omniscient.

Occasionally, they may be able to quickly ascertain a problem based on an intuitive sense of an app's behavior and an auto-generated error report from Airbrake. But most of the time, a context-free, vague bug report will mean no more to a developer than it would to you. Literally: without the details I outlined in my other posts — URLs, login creds, specific steps — you might as well submit the bug report to yourself. 

And having to spend time trying to glean meaning from such a vague report? For devs, that's about as fun as hanging out with these guys.

Single-click layer exporting in Photoshop

$
0
0

Use this sweet photoshop action to save out layers and groups with one click.

One of the most repeated tasks in the build-out process is saving out an individual asset in the comp as a .png or .jpg. If you ever find yourself repeating the same sequence of actions over and over again in Photoshop, STAHP, and open up that dusty actions pallet.

Before we get into actions, lets compare two ways to do this manually...

A bad way:

  1. Turn off all the layers behind your asset
  2. Use the slice tool
  3. Zoom in 1000% to make sure you're not cutting off any pixels, or leaving any blank ones.
  4. Save for web
  5. Delete all of the non-slices you just accidentally exported along with the one slice you did want, because you forgot to customize your export options.
  6. Remember which layers you hid to export that one piece, and re-enable them.
  7. Delete the slice you created that's overlapping another asset you need to cut out separately.
  8. Have an emotional breakdown as you realize you must repeat this process 99 more times today.

This was my terrible work flow years ago. Let's never go back there, friends. There is a better way.

A better way:

The best thing about this workflow, is that it's COMPLETELY automatable, meaning we can turn this in to a reusable action.

  1. Right click on the layer or group title and click "Duplicate Layer/Group"
  2. In the dialog that pops up, change the destination document to "New" and hit ok.
    • Now you have a new photoshop document with just that isolated asset!
  3. In the menu bar, select Image > Trim... > Transparent Pixels
    • Now your document is exactly the size of your asset, to the exact pixel
  4. Save for Web (works cleanly since you're saving the whole document - no accidental extras or generated filenames)
  5. Close your document.

And now you're back to your pristine Photoshop file, with your perfectly sized asset saved out and ready to go. There's nothing to undo to get back to where you were.

Now, let's look at how to set that up as an action.

The BEST way:

  1. Press F12

One keystroke, name that file, and you're onto the next one. How you do dis, you ask? ACTIONS my friend. Saving the steps listed in "A Better Way" as an action with a shortcut key is SUPER easy. 

Here's how:

  1. Select the layer or group containing your asset
  2. Open your actions palette (window > actions)
  3. Hit the "Create New Action Button", and name it. (I called mine "Asset to File")
  4. Press record (figure a. below)
  5. Carefully repeat each step listed in "A better way", including closing the document
  6. Hit the stop button (figure a. below)

Your new action should now look something like this:


Make sure to switch on the "dialog on/off" toggle box next to "Export" (figure b.). This tells the action to pause when the save for web window appears, so that you can change your settings and name your file before exporting. At this point, you can use your action on another asset, by selecting it, and hitting the play button (figure a.)

The last step is to assign a function key.

  • Select your action in the actions palette
  • Open the actions palette context menu (figure c.) and select "Action Options"
  • Choose a function key (and an optional modifier key if needed)

To save you some time, I've saved out this, and an alternate version of this action for you to download here. The alternate version only opens the layer in a new file and trims it. I bound this to shift + F12, and use it when I need to isolate the layer, but make adjustments before saving.

That's all I got! You now know how to make actions, and how to save out any layer or group with the press of a button. What are some of your favorite time-saving actions? I'd love to hear what tricks you guys and girls are using to speed up your build-out workflows.

Building a Traffic Heatmap with Google Analytics and R

$
0
0
For all of the reporting power that Google Analytics provides, occasionally I want to see data in a way it doesn’t natively support. Most recently, I was interested in understanding hourly and daily shifts in traffic across sections of a site. Knowing when these occur could help authors time their publishing schedules for maximum exposure. 
 
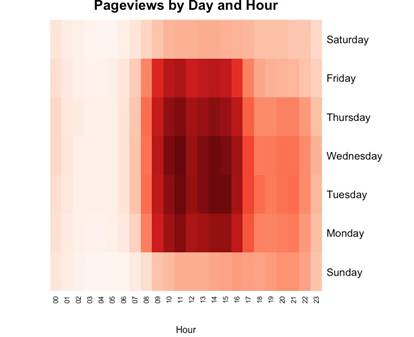
Here’s what I was looking for – a heatmap that boils a few month's worth of data into a weekly view. As you can tell from this example, traffic tracks closely to normal working hours. 


My first thought was to pull the data in CSV form from GA, hack it up in Google Spreadsheets or Refine, and then chart it out. But I soon found that I couldn’t find a way to reproduce this chart using their stock widgets. I looked at D3 and a few other charting frameworks and, though I was impressed, I wasn’t ready to commit to that learning curve. Plus, I didn’t want to spend a lot of time pulling data exports from GA if I could help it. 
 
Looking further afield, I remembered R. 

Building it in R

R is a scripting / programming environment geared to scientists, statisticians, and data wonks. I had spent some time working through CodeSchool’s R Course a few weeks back, just to see what it did. At the time, I didn’t have a use for it but I figured it would come in handy later. 
 
Sure enough, when I looked into it further, I found a heatmap function that would do precisely what I needed. And finding a post about connecting to GA data programmatically convinced me to spend a Sunday morning bulldozing through just enough R to munge data into the format I needed. 
 
The result is a visually interesting, visceral illustration of how users are hitting the site. Here’s how you can get the same thing, while hopefully not burning part of your weekend along the way. Fair warning though - this tutorial is on the technical side and uses libraries that are still in development. Caveat all the emptors!

Assembling your materials

Here's what you'll need to get started. This assumes you're running on Mac OS X.
  • Download and install R - this is the core binary for the language. Their site is a frameset nightmare, so I linked directly to UC Berkeley's mirror.
  • Download and install RStudio Desktop - this is an IDE that runs atop R. It's free and makes working with R much easier.
  • Get a copy of the heatmap script - once unzipped, this should give you the source code needed to create a heatmap. 
  • Download RGoogleAnalytics 1.2 - this is the library that helps us connect to Google. Get the tar.gz version; we'll use this later. Edit: Version 1.3 was posted a few hours ago and after a cursory look, it seems to work too.
Once you have all these, launch RStudio and take a deep breath. It's about to get real.
 

Installing the libraries

We use two major libraries in this script: RColorBrewer for producing sane color schemes and RGoogleAnalytics for getting the data. The latter relies on RCurl for network requests and RJson for parsing the data returned. 
Installing RColorBrewer, RCurl, and RJson

Most libraries in R are super-easy to install. Just issue a command and R installs the right thing from the Comprehensive R Archive Network (CRAN). Let's do it now. 

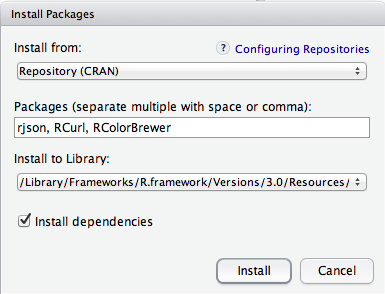
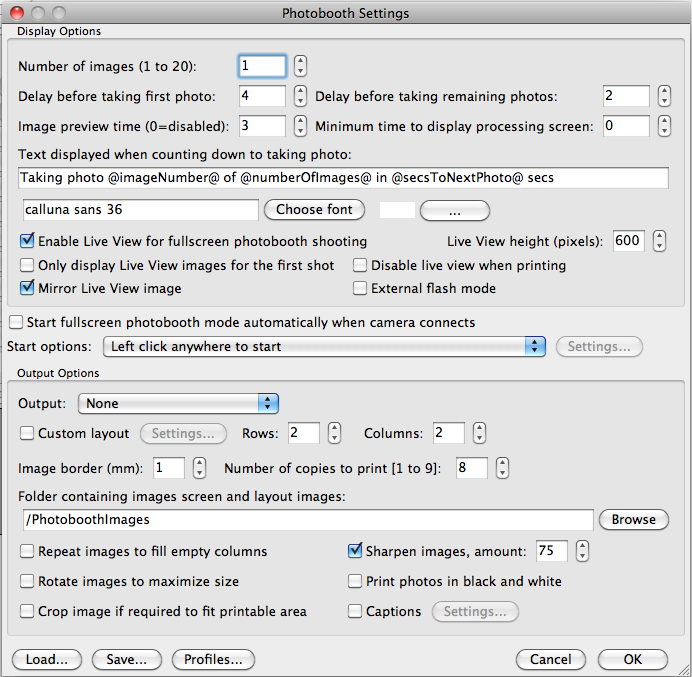
Navigate to the Packages panel and click Install Packages. In the dialog that follows, type rjson, RCurl, RColorBrewer  into the Packages field. Confirm the other settings match the screenshot below and click Install.

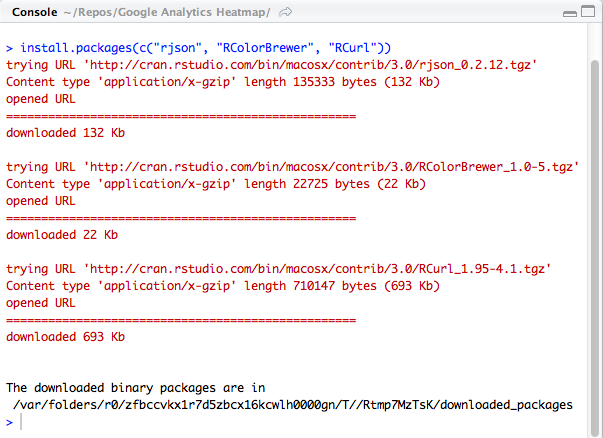
The installation process will write its status to the RStudio console. Once it stops, you should see a line that states that the downloaded binary packages are located in some byzantine path on your machine. Don't be afraid: this is good and signifies that they were installed properly.

Installing RGoogleAnalytics
Sadly, it's not the same process for RGoogleAnalytics. That library is still under significant development and, as a result, we'll need to install it from the file you downloaded earlier. 
 
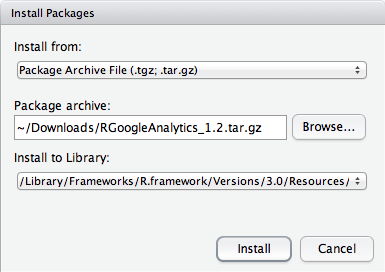
With RStudio open, open the Packages pane and click Install Packages. Choose Install from package archive and select the library you downloaded earlier. Once you're ready, click Install.
 
 
Once it's done, the console message should look similar to the previous step. For me, however, it complains that the package isn't available for R 3.0 but then soldiers forward and installs properly. I haven't traced down the cause but, if you know it, let's discuss it in the Issues.

Running the script

Connecting to GA
Provided you made it through the above steps mostly unscathed, we're now at the fun part. We're going to open the project, step through the code, authenticate to Google, and make a diagram. 

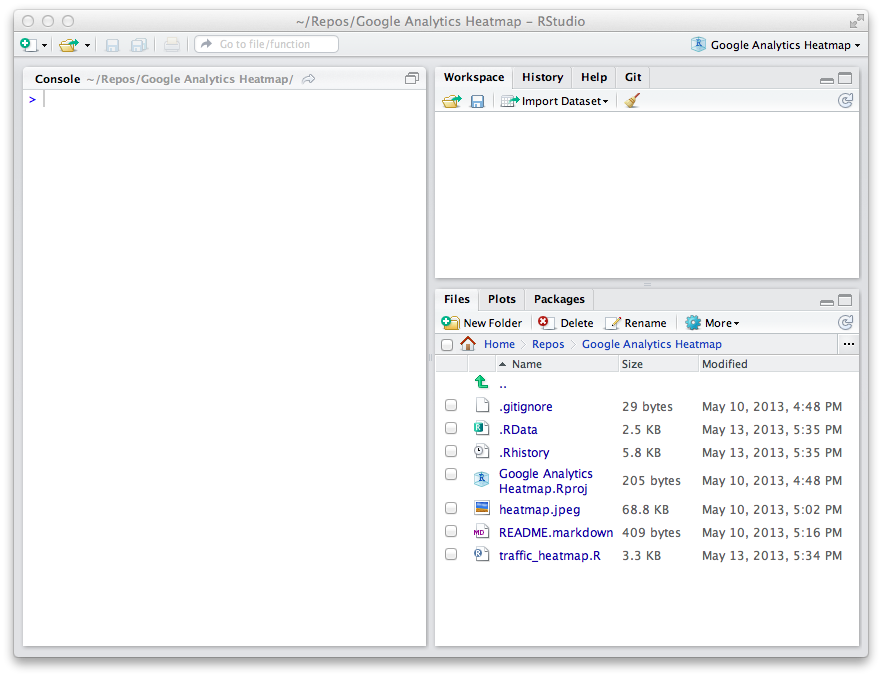
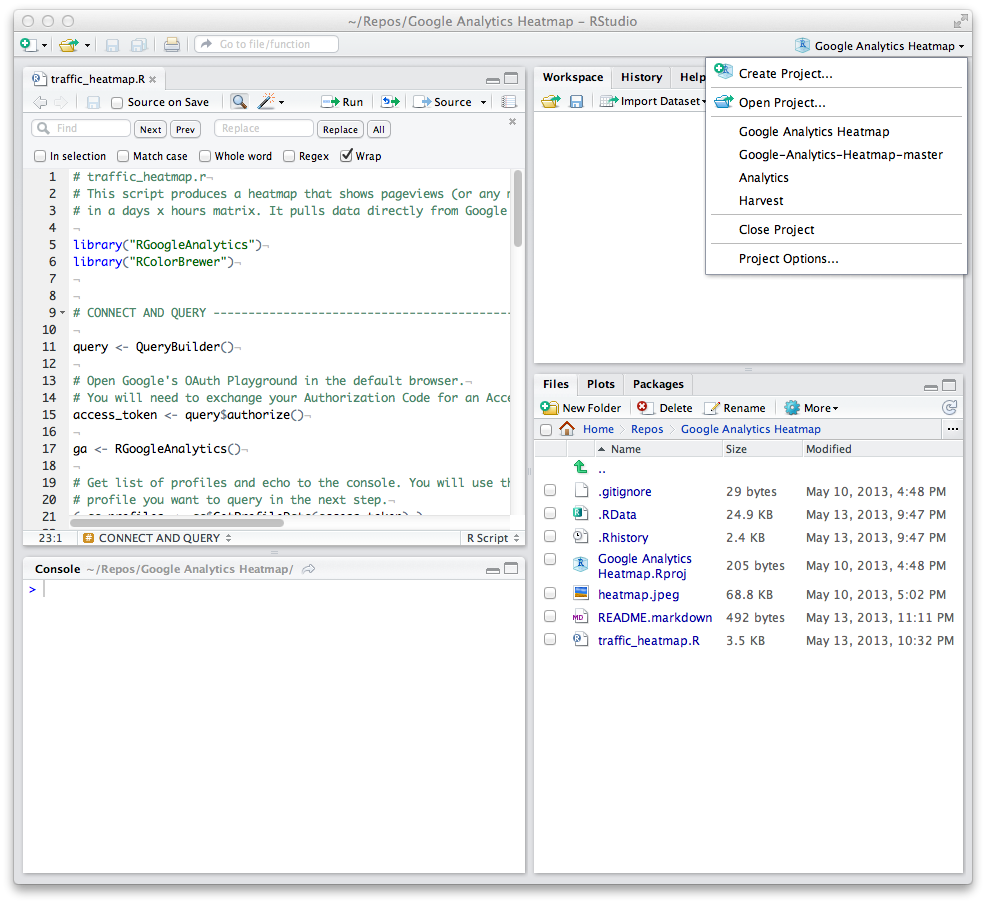
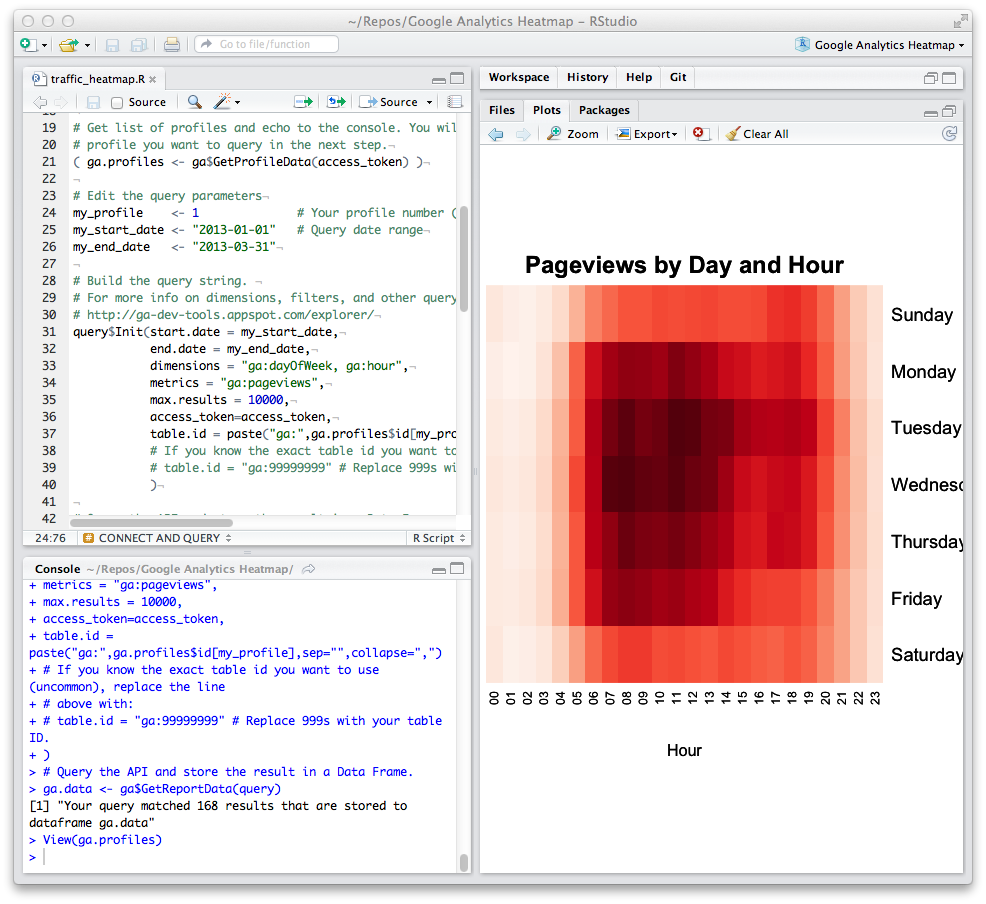
Open the Google Analytics Heatmap.Rproj project in RStudio using the project menu, then open traffic_heatmap.R from the Files pane. We'll do most of our work here. 

RStudio can execute code all at once or line-by-line. Because part of our script asks for user input, we want to move line-by-line. To do this, first ensure your cursor is on line 1 in traffic_heatmap.R. Then hit “⌘-Return” to step through each line in succession. Alternatively, you can click the Run -> button.
 
Do this until you execute the following line.
ga <- RGoogleAnalytics()
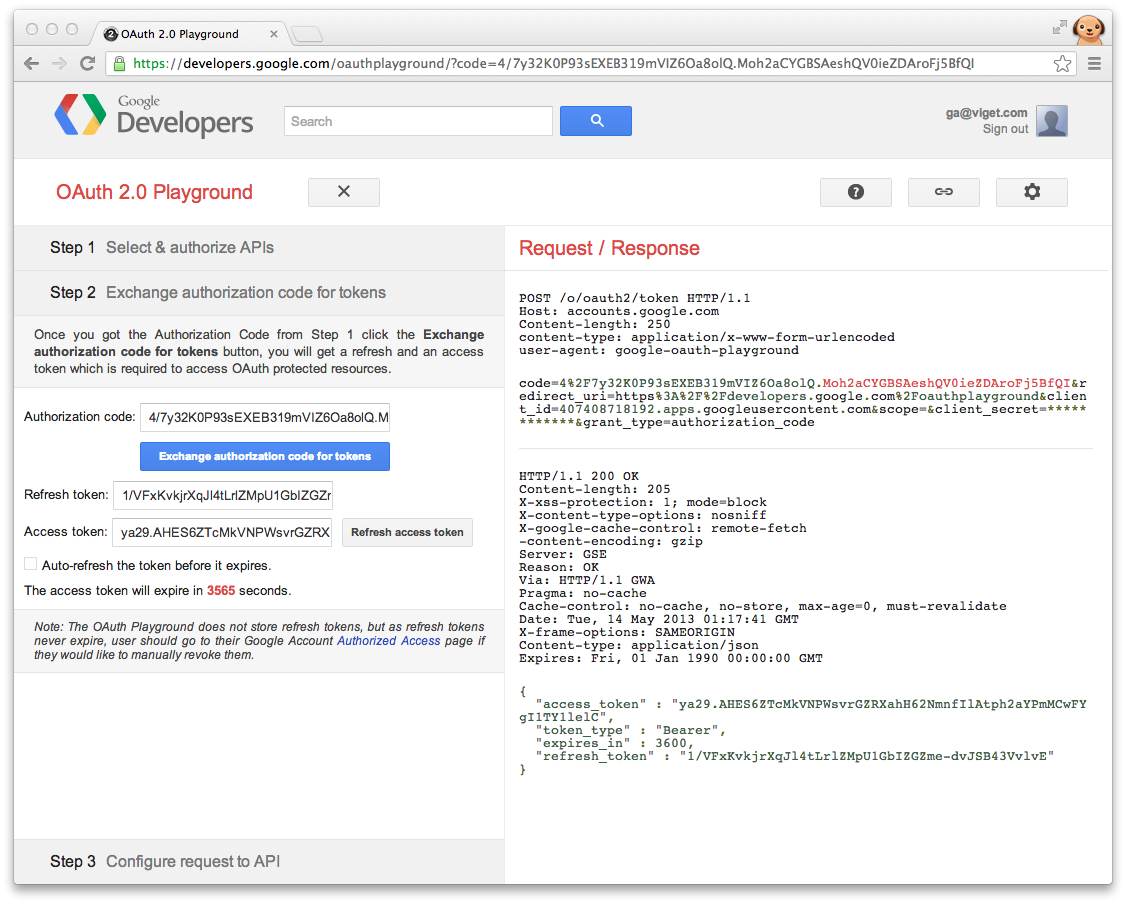
Once this line is run, Google’s OAuth Playground will appear in your default browser, asking you to authorize access. It uses the current active account so, if this is different from your GA account, you may need to log into that first and rerun the last line.
 
Once done, GA will allow us to exchange the authorization code for an access token. Do this, then paste the resulting token at the prompt within the RStudio console.
 
Choosing your profile

Since each GA account can manage many different profiles, you will need to choose the one you care about. Stepping through the code with ⌘-Return, you'll encounter this line.

( ga.profiles <- ga$GetProfileData(access_token) )

Running this will echo the profiles that you manage in GA. Find the number of the profile you want to use. This will be the number in the far left column.

1      2219134   www.example.com
2    239481199   www2.example.com
3    232342324   beta.example.com
4        47342   legacy.example.com
Querying and displaying

Now we can get some data. First, replace the "1" after  my_profile with the profile number you just chose. You'll probably also want to change the date range.

my_profile    <- 1           
my_start_date <- "2013-01-01"
my_end_date   <- "2013-03-31"
Once you're satisfied with that, move your cursor back to the my_profile <- your_profile_number line. Step through it and the rest of the code. You'll know you're on the right track when you see the following written to the console: 
> ga.data <- ga$GetReportData(query)
[1] "Your query matched 168 results that are stored to dataframe ga.data"
The code thereafter cleans up the data and modifies its format to something the heatmap chart can use. You can step through it as fast as your fingers will allow – there's nothing else to change. 
 
Once you're done, you should see the chart appear in the Plot panel. From there you can export the file to a format you prefer. 
 
 
Whew, that's it. You're done.

In Conclusion

While the initial investment of time was high – Sundays are in short supply! – it's trivial to run this again. Because of this, it becomes incredibly easy to:
  • compare different sections of a site
  • map unique visitors instead of pageviews
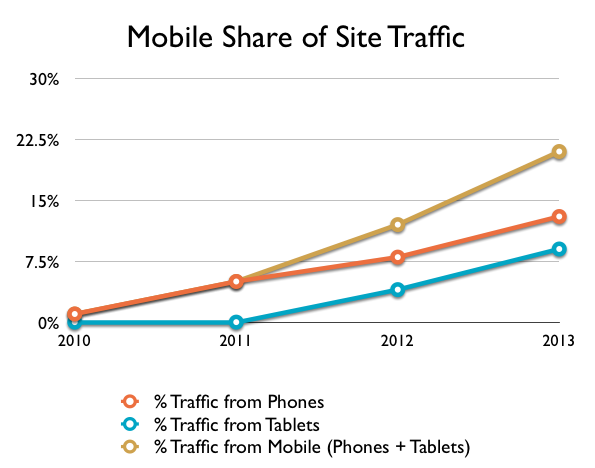
  • look for time drifts in device usage
  • gauge uptake from social media efforts
Essentially any dimension, metric, or filter available through the GA Reporting API can be used. So have fun experimenting with it. 
 
If you run into technical problems, I'll do my best to help out but I'm still learning too. Feel free to add any issues you encounter here. Same goes for any enhancement ideas. And if you're a benevolent R wizard who wants to improve my code, fork it and send me a pull request. I'd be much obliged. 
 

Oh, and by the way, we're hiring!

We're looking to grow our UX team in all three of our office locations. Check out our UX Designer job listing and, if you think you're a fit, please get in touch!

Share, Grow, Repeat

$
0
0

At Viget, we believe in sharing. We share our ideas on our blogs, we share our knowledge at industry events, we share our entrepreneurial experiments via Pointless Corp, and we share our adventures in pictures and videos.

Sharing makes my work easier and more effective. Here are three examples of how sharing comes up in the recruiting work I do:

  • We've asked the last twenty-five people we've hired how they first heard of Viget. Ten of them referenced something I would categorize as sharing -- a blog post, our code on github, an application we built and made public, etc.

  • About a quarter of recent applicants have mentioned their affinity for our Pointless Corp endeavors. This reveals that the candidate has done research into Viget and they've uncovered a small, quirky, but important aspect of our company. It's a short-cut to confirming culture fit -- a quick way to know that they care about something that's important to us.
  • Here's how a recent applicant started his email:

"Last week I attended a talk that Trevor Davis hosted and was impressed by the quality of work he reflected and his knowledge and passion for Front-End JavaScript. I felt immediately drawn to finding out more about his workplace, as it seemed very well aligned with my interests, passions and experience."

Is there a downside to so much sharing? Yes. I think sometimes we paint such a full picture of what it's like to work here, that applicants get ahead of themselves and imagine themselves fitting into that picture before we've had a chance to discuss skills, talents, and the actual job responsibilities. It can sometimes make evaluations and rejections that much more stressful and disappointing, I think.

Is it hard to share so much? Not really. It comes naturally to many people here -- they love sharing what they're learning on the job and many of them are gifted writers and speakers. For others, it may take more work, but they believe it's worth the effort. Sharing is inherent to the Viget culture; it's not forced.

Does Viget share everything? No, not with the whole world anyway. There is a lot going on here that only gets shared internally (via basecamp, campfire, and yammer, mostly). And I have conversations all the time with coworkers where I'm surprised to hear some details about what they're doing. 

Should applicants share a lot, too? I think so. When candidates are active on github, dribbble, twitter, or their own site it helps us determine if their skills and interests are relevant. When they are, we get excited (and, of course, prepare to get to know them much better). We still look at resumes and cover emails. I will still dig you up on LinkedIn. But when you share what you're learning, making, and experimenting with, we have such a better idea of what it might be like to work with you. And I think by hiring people for whom this comes naturally, we continue to nurture the Viget culture of sharing.

Is this blog post sharing thoughts about sharing? Yes, yes. Very meta.

Want to share with us? We're hiring!

How Startups Get to Great Design: Q&A from Boulder Startup Week 2013

$
0
0

The Event

As part of Boulder Startup Week, Viget hosted a moderated panel session, How Startups Get to Great Design. With over 150 people in attendance, this event built upon the success of our 2012 event Startups + Great UX = Great Success.

This year’s event brought together designers from agencies and product companies to discuss what works for startups when going through a redesign. The session was valuable, with moderator Jackson Fox doing an excellent job of keeping the topics on track and making sure each panelist had a chance to speak to their experiences.

Panel

(For more photos, please visit our Flickr Page!)

The panelists, talented designers working inside local startups and agencies, included:

The floor then opened up for the Q&A portion. 

Question and Answer

If you didn’t get the chance to get your question addressed, please use the comments below and the designers will do their best to respond here.
 

DIY Photobooth and Slideshow: A Quick How-To Guide

$
0
0

One thing that makes our annual Viget birthday celebration so memorable is having our entire team together in one place. We always make sure to capture countless photos, but this year we added a new twist by setting up our own photobooth and projecting the images as a real-time slideshow throughout the evening.

It was a total hit! The magic of the photobooth is that it appeals to hams and shyer folks alike. Since people can see and manipulate their images for themselves, they feel more in control and at ease -- whether they want to strike a pose or just smile. A few funny props and costume items encouraged everyone to get a little silly and we wound up with some truly unique shots. The booth also became an attraction in and of itself, drawing teams together for group shots -- but, more importantly, giving folks from any and all teams a chance to connect in fun, spontaneous ways.

Much of the advice available about DIY photobooths leads you down some winding paths, involving complex, hard-to-find equipment (like an old Dell screen in a box!). That’s partly because most booths also require a printer to provide people with a strip of printed photos as a souvenir. But, since printers are such a pain, we decided to keep the images digital, presenting them instead as a slideshow throughout the evening, and then sharing them on Flickr.

Eliminating the printer and keeping our equipment simple made our booth time-efficient, space-efficient, and a snap for people to use. Here’s what we used and how we did it:

Equipment

Setup

We had a few requirements for the setup: it couldn’t take up a lot of space; we’d need enough room in the field of view for a lot of people to gather; and we’d need the laptop close enough for people to see the screen easily (preview of the shot).

Here’s how we met those requirements:

  • Backdrop screen flush with the back wall
  • Key light pointing down at a 45 degree angle from the center of the backdrop
  • Secondary light pointing across the backdrop screen to minimize shadows produced by the key light
  • Camera on a tripod about 6 ft from the center
  • Laptop on a music stand right next to the camera (giving the slight illusion that people are looking at the camera even when they’re looking at the preview on the laptop screen)
  • Slideshow projector screen angled to cover some of the setup and make it more private, with a 10ft VGA cord running from the laptop to the projector
  • Kensington remote sitting on the laptop so people know to use it

If you follow the above setup, here’s what your photobooth goers will see:

Application Settings

If you choose to use DSLR Remote Pro, here are the settings we recommend.

Go to File > Photobooth Settings and you’ll see the following screen.

We chose to have the photobooth only take one picture per click, counting down from 4 seconds, and previewing the shot for 3 seconds. We changed Live View height to 600 pixels (if you make this too large you won’t be able to see the countdown text or the frame images you can create and add to the Photobooth directory).

One last important change we made was the Output. This only relates to printing, and if you have it turned on, it will try to send the image to a printer and create problems. If you select JPEG Copy Only, it still outputs a print file to a folder and creates a lag in the time it takes until you can click for your next image (by about 15 seconds). By selecting None, it removed the lag and the printing piece and simply saved the file to the directory specified in Preferences.

To enter the full screen photobooth mode, connect your camera, then go to File > Fullscreen Photobooth Mode or just hit Command+F4. Now test away!

Slideshow

The last piece we had to figure out was how to basically live stream the photos into a slideshow that would display on another screen. After doing some research, we couldn’t find a slideshow application that could pull in new photos added to a directory once the slideshow starts. The solution is actually surprisingly simpler than buying an application and customizing it to do the work. The solution is a rotating desktop background.

Assuming you’re on a Mac, go to System Preferences > Displays (when you’re connected to the projector) and make sure "Mirror Displays” is not selected. This will mean that your laptop or primary screen will function as the photobooth preview and your second screen will display the pictures in the slideshow.

Next, go to System Preferences > Desktop & Screen Saver and add the directory where you’ve chosen the images from DSLR Remote Pro to save to. Make sure this is set up on your projector screen, not on the primary screen.

Finally, simply select “Change Picture” and change the frequency to “Every 5 seconds”.

Now, you’ll have a nice fading slideshow of all the images taken in the photobooth, with the slideshow moving chronologically through every photo taken. The only caveat is that once it starts on the first photo, newer photos (i.e. images that photoboothers are taking as the slideshow proceeds) won’t be displayed until the slideshow circles all the way through to the beginning again. To get around this, after we had accumulated enough photos, we took a lot of the older pictures out of the main directory to make sure only new photos were being displayed.

And That's It!

Within about a half hour, we had the photobooth available for general use and, as the first photos appeared on the big screen, more and more Vigets lined up for a turn in front of the camera. It was a fun, easy way to capture some great memories (see the full set on Flickr). Give it a try at your next event.

Three Reasons I Hate Laptops in Meetings

$
0
0

As someone who has been a professional software developer for quite some time, I often joke that each year I hate technology more and more. I'm not going to "check in" on Foursquare, won't ever use a daily deal, don't do Facebook, and finally deleted my LinkedIn account last year. I'm not swearing off all technology, though — I use Twitter in place of RSS and Strava to track my rides. I believe in the selective application of technology — any tool or service I decide to use must provide some perceivable value.

I like to apply this same philosophy to my professional work environment. Now that the Viget team is spread across three locations, there are tools and services that help us communicate across offices. Having a laptop on-hand is definitely part of our strategy for having an effective distributed workforce. This, too, is a double-edged sword. I've seen instances where having a laptop in a meeting can quickly connect people across offices, allow someone to perform some rapid on-the-spot research, and even be an effective tool in a remote interviewing situation.

However, as useful as this technology can be, I've also witnessed how quickly it can derail an otherwise productive meeting. Here are three reasons why I think laptops can be meeting poison:

It's a Distraction

Yes, there are those dull meeting moments and, especially when you have remote attendees, periods of awkward silence. During those periods, there's a strong temptation to briefly check your email, or send a quick IM, or respond to someone in Campfire, or check Twitter, or …

… you just missed something important. You can't ask her to repeat what she just said. Everyone will know you weren't paying attention. Your attempt to fill that void might have caused you to miss out on some key detail of this new project.

You're Ineffective

Now you've divided your attention between two activities. Despite the myth of multitasking, you're now less effective at both tasks. A meaningful meeting with key participants requires the same focus as responding to a colleague or client via email. Our "addiction to new information" makes that "quick" context switch so attractive that you can't resist it. But it's not quick. Choosing distraction over focus robs others from your valued insight that only your dedicated attention can provide.

It's Just Poor Manners

Maybe I'm in this meeting with you. I can see you sending that IM while I'm asking a question about a core feature in this application. Maybe you just responded to one of my emails while I know you're in a client meeting. In both cases, you've sent the message that others' time is worth less than yours.

What to Do?

Here are a few strategies that I've found to be effective in minimizing my own meeting-time distractions:

  • Peace out — Not all meetings are created equal. If you don't think you're needed in a particular meeting, politely decline the invitation. Already in a meeting that doesn't seem useful? Excuse yourself and suggest an offline follow-up instead.
  • Kick it old school — Grab a notebook and leave the laptop behind. Not only will you remove the IM / Twitter / email distraction, the constraints that it places on your note-taking will force you to capture only the most important information.
  • Close up shop — If you do need to bring your laptop to a meeting, quit the applications you don't need to use. If you're giving a demo of your work, close it when you have finished your presentation.

Are you frustrated by this seemingly recent practice, or do you think I've overstated the negatives and omitted some glaring positives? Let me know.


One of Your Deliverables Should Be Education

$
0
0

School of Sweltz

Every Friday at Viget we gather for a company-wide meeting and lunch (brunch for our Boulder folks) and during that time one of us delivers a short presentation on a relevant topic. We call it a Labshare -- a humble routine indicative of the value we place on sharing and educating. A more formal example: our quarterly, public Google Analytics training. Whether it's buttoned up or strictly casual, we always look for opportunities to share and learn, particularly during the course of our client work. Pairing our deliverables with durable skills means our clients walk away with more value than can be detailed in a Task Order.

While a feel-good sense is intrinsic to this approach, there are practical reasons we do this as well. Here are a few recent examples:

  1. The Situation: During the course of month-to-month Google Analytics work, we recognized there were smaller tasks our client could handle and, consequently, be positioned to apply their budget in more meaningful ways.

    Our Approach: Instead of simply resolving a request or answering a question without providing explanation, we took the time to walk the client through our approach and rationale, showing them the steps along the way. In the case of Google Analytics, this largely took the form of screen-shares and navigating the GA interface to find a particular piece of data. In addition to this day-to-day encouragement, we also conducted onsite training to foster even more self-sufficiency.
     
  2. The Situation: With talented designers in-house, our client's team was curious to better understand modern techniques and tools in the area of UX design and contribute more to the work at hand.

    Our Approach: In this instance, we invited the client to our office for an afternoon of training in OmniGraffle, our preferred wireframing tool and a mainstay of our creative process. From there, we structured our reviews of new material in a more iterative, collaborative way, inviting the client more and more into the design process. The client, in turn, began to pass along these skills to in-house team members, which bettered their design process in various other areas beyond our specific project.
     
  3. The Situation: Our client had limited funding for ongoing support from Viget, yet needed to update and tweak (in reasonable ways) the Rails-based site we built as part of our project.

    Our Approach: The most complex example of the three listed here, this scenario was also the most rewarding. It’s not unusual for our client teams to lack in-house Rails developers. Understanding this at the start of a recent project meant we could steadily move the knowledge bar up throughout the engagement. We began by encouraging our client to complete a few online courses; followed by thumbing through more advanced materials; and, then, at the point when our Rails app began to take shape, we sat with them to walk through the general architecture and data conventions. This process was an extended one, to be sure, and covered other key topics, such environments and deployment processes Fast forward to today, and our client is committing small updates to Github and pushing to production.

The examples here certainly aren’t meant to trivialize the expertise required in these areas. As creative, digital folk, we know it takes years (years!) of focus and experience to allow us to consult with clients in these ways. That’s why most clients come to us, after all...because of our expertise.

Transferring a bit of that knowledge and skill to allow your client to achieve more online (all the while tending to their product or organizational objectives) is a rewarding experience. Maybe not 1:1 dollars rewarding, but certainly positive juju for one’s business and heart-space.


Join Your Friends at Viget for the “Tour de Avery”

$
0
0

Hello Boulder friends. To celebrate the wonderful spring weather, we're organizing an event we're calling the "Tour de Avery". The idea is simple:

  1. Grab your bike (or rent one from a B-cycle kiosk)
  2. Meet by Boulder Creek
  3. Ride the bike paths to everyone's favorite brewery
  4. Maaaaaaybe cool off with a cold beer when you get there

If this sounds like it's your thing, come join us on June 6th at 4pm by RSVP'ing here. The route to Avery is a total of 5 miles each way, and we'll be taking both the Boulder Creek and Goose Creek paths to get there:

Tour Map

Hope to see you there!

The Big Argument for Responsive Design

$
0
0

At our last TTT, Viget’s company-wide quarterly event in April, Mitch Daniels, digital analyst, shared some thoughts on the state of the mobile web. He’s posted about The Rise of The Second Screens previously; but, it was a great reminder of what, to me, is the big argument for responsive design:

The number of unique screen resolutions being used to access web sites is increasingly varied and growing at a rapid pace.

Responsive design is not the answer to supporting every user that wields a mobile or tablet device. However, it has emerged as the best strategy for reaching the largest variety of devices with the least fragmentation of assets.

How Many Unique Screen Resolutions Hit My Web Site?

To find out, we looked at data from a handful of sites that we’ve worked on over the last four years. Some of the top resolutions included 1920x1080, 1600x900, 1440x900,1366x768, 1280x1024, 1280x900,1280x800, 1024x768, 768x1024, and 320x480.

Notice how similar some of these screen resolutions are? Today, there are no longer any gaps between screen sizes.

But, the other change that’s astounding is how many total screen resolutions, on average, hit web sites beyond these top resolutions. In Q1, 2013, the average unique screen resolutions was 232. Two hundred and thirty-two. While there’s some browser, device, and reporting artifacts* influencing this number, it is interesting to see the trend across the years:

Unique Screen Resolutions (Average) from 2010 to 2013

Q1 2010 - 97
Q1 2011 - 129
Q1 2012 - 229
Q1 2013 - 232

Within a three-year time span from Q1 2010 through Q1 2013, we’ve seen 139% growth.

We then filtered the results by the number of unique screen resolutions related to 80% of the visits to the sites. This helps give a sense of how unique screen resolutions correspond to the majority of traffic to web sites.

Unique Screen Resolutions - 80% of Visits (Average)

Q1 2010 - 7
Q1 2011 - 9
Q1 2012 - 13
Q1 2013 - 15

So ... If we want our content and functionality to be optimized for 80% of our users, we cannot design for a single screen resolution. This data clearly indicates that designing for a single screen resolution is a thing of the past.

Mobile devices, like electronic music, texting, and cars that drive themselves, are here to stay. Consider that Adweek recently reported that by 2017, mobile devices will account for one-fourth of online sales in the U.S. Here’s even more data on screensize.

In the past six months alone, we have seen the share of mobile traffic to various client sites grow by up to 75%. While device usage varies widely by individual site, some clients now see a large majority of their traffic visiting on devices of various sizes. Here’s how the mobile share of traffic has grown, on average, over the years:

Based on average data from random sampling of client sites Q1 for 2010 - 2013.


Some Important Changes In Mobile Device User Behavior

Back in the days when there were fewer mobile devices and, thus, fewer screen resolutions to consider, we could somewhat reasonably intuit users’ needs and intent based solely on the device they were using. This is increasingly misleading. According to Mobile Search Moments Study, nearly 80% of all mobile searches take place from home or work, locations in which a desktop computer is often readily available. No longer are mobile devices used because there is no alternative. Worldwide, calling mobile devices a “second screen” may also be a misnomer as lack of infrastructure or hardware costs drive increased use of mobile devices as the primary device.

We also see an increasing trend toward multi-channel access. Users who start their experience on one device will move to another when necessary. They’re growing more accustomed to expecting parity across devices, not simply stripped-down versions of the desktop site when accessing from a mobile device. This is an important consideration as responsive design assumes Universal Access to content. Read more: Google Report on Multi-channel Use.

Why Can’t I Just Do Responsive Later?

You can. But, it costs more. We’ve found from current projects that it’s very hard to retrofit a site to be responsive. Responsive design isn’t just thinking about the “mobile design” or “tablet design”; but, instead, about “how does this look at 400, 500, 600, 700 ... 1,200px?”. Getting from a fixed-width desktop design to responsive design requires, at a minimum, the CSS, HTML, and JavaScript rewritten to account for flexibility. Oftentimes, the delivery and management of content needs to be adjusted as well.

Over the last year, we’ve had several clients who have come to us with sites designed years ago for desktop whom we’ve worked with to retrofit their sites to be responsive. Retrofit isn’t really the right word for it, though. We often need to rebuild the front-end architecture to achieve the necessary site performance (speed), which is much more important for a responsive site that is consumed on mobile. In addition, we also usually need to redesign UI elements and update the backend application or content management system. This level of effort represents a significant additional cost that can be avoided if responsiveness is planned from the onset.

Four Arguments Against Responsive Design

Not everyone is a responsive design champion; but, there is a sense that it’s becoming the price of entry for web design. Here are four arguments we hear against responsive design, along with a bit of Viget-y perspective:

  1. Costs more upfront, harder to do. - This is true; but, it evens out over time.
  2. Levies heavy technical requirements, especially on asset delivery. - Same as 1.
  3. Non-technical web editors don't know how to produce things that won't muck up the responsive design. - Project-dependent, but largely false.
  4. Can't / don't want to migrate old content. - Very true and very problematic. There are strategies around this though.

Learn More

Responsive design is an important strategy for addressing mobile and tablet users. Here are some posts where we talk about different aspects of responsive design:

… browser, device, and reporting artifacts* and other notes.

Some issues that impact unique resolution reporting include:

  • Some browsers calculate screen resolutions differently.
  • There are long-tail visits that represent a pixel difference and are not something you would design differently for ... This is why we’re interested in knowing the number of unique screen resolutions that make up 80% of visits. It’s also interesting to note that, when we looked at broad ranges, we discovered that, in some instances, resolutions with at least one dimension > 1600 account for 16% of visits, and resolutions with at least one dimension < 500 account for 11% of all visits. These resolutions represent the more extreme ends of the spectrum, and a vast majority of visits fall somewhere in the middle, as explained here.
  • Giant monitors (like the ones we use) have large screen resolutions; but, we often browse on 1/2 or even 1/4 of the screen. GA only reports the actual monitor resolution, not the browser size.
  • Screen resolution is not always a great indicator of device size or browser size. High-density display devices have relatively high pixel counts, but are still small view-ports. It is important not to confuse screen resolution and view-port size. For instance, the Samsung Galaxy S4 has a resolution of 1920x1080, which we might confuse for a large desktop monitor, but it isn’t.
  • While the number of unique screen resolutions is a useful statistic, the % mobile visits also illustrates the range of devices that we're seeing hitting web sites these days.

Data from Google Analytics and a handful of sites we’ve worked on over the years. We’ve excluded any resolutions that accounted for fewer than 1/10,000 visits.

Special thanks to Mitch Daniels, Paul Koch, Todd Moy, Jeremy Fields, and Oliver K McGinnis for their contributions and assistance on this post.

Auto-Saving Screenshots on Test Failures & Other Capybara Tricks

$
0
0

Recently, when working on a JavaScript-heavy Backbone.js + Rails application, I spent a significant amount of time working with Capybara and the JavaScript driver Poltergeist for automated browser testing. After struggling with some specific asynchronous test steps, I stumbled across a great blog post detailing some effective asynchronous helper methods: wait_for_ajax, wait_for_dom, and the recently removed Capybara method wait_until. I ended up using a slightly modified version of wait_until that allows me to pass in a block that must return true:

def wait_until
  require "timeout"
  Timeout.timeout(Capybara.default_wait_time) do
    sleep(0.1) until yield == true
  end
end

wait_until { dom_element['class'].include? "is-active" }

While these asynchronous helper methods are great for assisting with finicky JS tests, I ran into some frustration when tests would fail on our Continuous Integration (CI) server (at Viget we use Jenkins). Tests involving JavaScript rely heavily on timing. It is fairly easy to have a test pass on your speedy development machine, only to have the test fail on CI either because it is running slower due to parallel builds happening or simply because of the timing of executing the assertions. Even after increasing the Capybara.default_wait_time setting, I was still getting seemingly random test failures.

After a few times ssh'ing into our Jenkins server, modifying the test to save a screenshot, and then scp'ing that file back to my machine in order to view it, I decided to try and automate this process. My first idea was to make a plugin that would automatically save a screenshot of a failing test and then email that image to a configurable set of receivers. After playing around with it a bit, I realized that you could just access the images hosted right on the CI server.

This bit of code will automatically take a screenshot of a failing JavaScript test. I've decided to assert that the type of test is ':js => true' because the default Capybara driver (RackTest) does not support saving screenshots.

RSpec.configure do |config|
  config.after(:each) do
    if example.exception && example.metadata[:js]
      meta = example.metadata
      filename = File.basename(meta[:file_path])
      line_number = meta[:line_number]
      screenshot_name = "screenshot-#{filename}-#{line_number}.png"
      screenshot_path = "#{Rails.root.join("tmp")}/#{screenshot_name}"

      page.save_screenshot(screenshot_path)

      puts meta[:full_description] + "\n  Screenshot: #{screenshot_path}"
    end
  end
end

Now when a finicky JavaScript test fails on Jenkins, the auto-emailed report includes a URL to the saved screenshot:

I was pleasantly surprised to find that Jenkins converts a path from the console output into a convenient URL.

This allows me to simply click the provided link to see what is happening in the browser, which has been an immense time-saver in diagnosing failing tests.

What kind of tricks do you use for asynchronous browser tests and/or debugging them? Please leave a comment below!

Web Interfacing With Arduino

$
0
0

So, you've got what it takes to turn on LEDs and move some motors around using your trusty Arduino. You also have some skills writing web code. Here’s a simple walkthrough of how to combine your great talents and make a nice web interface for your Arduino project!

Communication with the Arduino

Here at Viget we write a fair amount of Ruby code, so this post will focus on interfacing your Arduino with Ruby. Using the serialport gem, communication with your Arduino over the serial port is easy. To enable serial communication from your Arduino, you need a line of setup code:

setup {
    Serial.begin(9600)
}

You can then send out data anywhere in your program:

loop {
    ...
    Serial.println("Hello world!")
    ...
}

Catching this on the Ruby side is straightforward as well. With some set up to specify the port, you’re ready to listen:

require 'serialport'

port_str  = '/dev/tty.usbmodem1411'
baud_rate = 9600
data_bits = 8
stop_bits = 1
parity    = SerialPort::NONE

sp = SerialPort.new(port_str, baud_rate, data_bits, stop_bits, parity)

while(true) do
  message = sp.get
  message.chomp!

  puts message
end

This code will read every message coming through the Serial port and print it out (messages come in with a trailing newline character so .chomp! handles that for you). It's worth noting that sp.gets blocks until a message comes in from the Serial port.

Sending messages back to your Arduino from Ruby can be done using sp.write(message), and catching the messages with Serial.read().

Communication with your browser

Now that you’re catching updates from your Arduino in real time, we’ll make use of websockets to instantly update a web page. There’s a great article here explaining this technology and how to easily get yourself set up using Ruby. Here are the basic code snippets.

In your Ruby file:

require 'em-websocket'
require 'json'
require 'serialport'

sp = SerialPort.new('/dev/tty.usbmodem1411', 9600, 8, 1, SerialPort::NONE)

EventMachine::WebSocket.start(:host => '0.0.0.0', :port => 8080) do |ws|
  ws.onopen    { ws.send "hello client" }
  ws.onclose   { puts "WebSocket closed" }

  ws.onmessage do
    ws.send message_from(sp).to_json
  end
end

def message_from(sp)
  message = sp.get
  message.chop!

  { "event" => message }
end

In your HTML file:

$(document).ready(function() {
    ws = new WebSocket("ws://localhost:8080");

    ws.onopen = function() {
        ws.send("hello server");
    };
    ws.onclose = function() {};

    ws.onmessage = function(evt) {
        console.log(evt.data);
        var message = JSON.parse(evt.data);

        // code to update the page given the incoming message

        // send a dummy message back to initiate
        // the onmessage callback again
        ws.send("next message please!");
    }
});

We now have an instant channel for communication between Arduino-listening Ruby code and JavaScript. With the Ruby file running, we can open up the HTML file in a browser and the communication loop will begin. Ruby will then wait on the Arduino for a message over the serial port, work it into a hash, and ship it over to our JavaScript in JSON. The JavaScript then needs to send a dummy message back so the process can start again.

At this point, your web skills can take over and you can update divs and spans every time something happens on your Arduino. This is an easy way to give a pretty face to our Arduino projects. Bonus points for running your web server on a cheap Raspberry Pi.

Extra credit

Take a look at Dino. This is a sweet little gem that allows you to read from and control your Arduino using only Ruby code -- and it gives you the ability to send commands in real time to the Arduino such as servo.position = 80 or led.on. With Dino, you would not need your Arduino to respond to specific strings coming over the Serial port, but instead could have your Ruby file control the Arduino itself.


Think this is a good idea? Found a much better way to interface your Arduino with the web? I’d love to hear your comments below.

Say Viget, The Game

$
0
0

Viget is an awesome company with a strange name. It (roughly) means "flourishes" in Latin. But, unless you're a Latin scholar, knowing how to pronounce "Viget" can be difficult (and, even if you are, there is debate). So, in 2005 we created a website dedicated to teaching you how we have always said it, ever since it was just a code word selected by our original founder. And, while the old site served this purpose very well, it needed an update.

We Made A Game

Welcome to the new Say Viget: The Game. You play as the hero lab-rat trying to get to the cheese at the end in record time. For every five coins you collect you receive the positive reinforcement of how to say "Viget." You only get three lives, so avoid the spikes and don't fall off the platforms!

Brainstorm and Process

We had a few ideas before deciding to make a game. We debated creating a mini-site or a one-pager, but scratched both ideas as being "too 2012." After much deliberation, we decided that a game was a perfect fit for our team.

One of the early challenges we faced was creating a game that fulfilled the core purpose of Say Viget  -- teaching visitors how to pronouce "Viget." We had to collaborate closely to strike a balance between features that would reinforce our purpose and fun features that might distract from it. Then, while the design and UX teams strategized, illustrated, and iterated on concepts and features for the game, I was busy prototyping, building a world (literally), and coding a foundation from which it could grow. Before launch, multiple sessions of walking through the game and refining interactions helped us achieve a consistent and purposeful gameplay experience. 

In The End

This project helped us become even better at collaborating and pushing each other in a creative direction. We realized (again) that sometimes building something just because and pushing ourselves to learn something new really is the best way to grow. It was certainly a ton of fun. With that in mind, we hope you have as much fun playing Say Viget as we did making it. 

More to Come

We plan to go into more detail about what went into making the game, the technical and coding challenges we faced, and third-party libraries that helped us. If you're interested learning something in particular about game development (or if you have something to teach us!), leave a comment and let us know!

Finding Completion Points Within a Project

$
0
0

The feeling of being “done” is hard to beat

I recently started receiving the Denver Post on a daily basis. When I began the subscription, I was unsure if I would actually read it, given the availability of every news article I could ever want on the Internet. Surprisingly, I immediately found myself reading the entire newspaper nearly every day, and I continue to do so. The reason, I’ve discovered, is that I can finish the newspaper.

Similarly, another Vigeteer took a few days off to repair the fence in his yard. When he returned to work, he spoke to how great it felt to be able to actually finish something, to be able to say “I’m done.” The sense of completion was satisfying.

These seemingly unrelated experiences really got me thinking about the fact that the feeling of being done is something most people relish, and it’s something we rarely get to feel when working through web projects. Certainly web sites launch and that, often, is a major milestone worth celebrating; but, typically, the work is not done there. There’s always more to do with updates, bug fixes, and second, third, or fourth phases.

Feeling like you’ve completed something can be an important element to being satisfied at work. I doubt anyone wants to go day after day without feeling like progress has been made or that they’ve finished something. This is why, I think, as a Project Manager it’s important to try to provide that sense of completion often throughout a project. Here are some thoughts on how this can be done:

  • When working on a retainer or support project, which has no launch or end date, be sure to focus on features being worked on and celebrate the individual feature launches. Even if it’s a small item that took a day or two to complete, congratulate any team members who worked on it for finishing that feature.

  • Even if you are working on a project that has a launch date, if the project will take longer than a couple of months, identify specific goals and celebrate when they’ve been reached. Every few weeks, team members should feel like they’ve completed something. If too much time passes without anyone feeling things are getting done, motivation and interest can wane.

  • Whether working on an agile project or not, always conduct the iteration retrospectives. For all types of projects, retrospectives provide an opportunity to not only talk through what could go better as the project progresses, but also to reflect on what’s been completed to that point. Celebrate the progress and completed features.

  • Tell outside people about the things your project team has completed. Discuss the great work someone has done with their managers, or their peers, or the whole company if that’s an option. Here at Viget, we meet as a company once a week and project managers are all able to highlight what was completed on their projects in the past week. Seize those opportunities to be specific about what features can now be called "done."

These all may seem like common sense thoughts; but, they are still important to remember. Our job as Project Managers includes ensuring the team is as happy as possible, as well as helping the team feel that sense of completion along the way.

Also, don’t forget to take a moment to look at what you, as a Project Manager, have completed. In my career, I’ve spent a year on a project without feeling like we finished anything. It was a tough year, and I’ve used that as a learning experience to take time to reflect on what has been completed, even if the project, as a whole, will not be done for quite some time. Fixing a fence post on a weekend or reading the newspaper each day should not be the only time we feel like we’ve finished something.

How have you been able to surface the feeling of completion throughout your projects?


“Anything But Work”: Viget During Downtime

$
0
0

We talk a lot about work-life balance around here. We proudly offer benefits like 15 paid days off (and more earned over time), 9 paid holidays, 2 community service days, and flex hours --  all to ensure that everyone has enough time to pursue their thousand-and-one hobbies, hang out with family and friends, and maybe even just relax. And we share informally all the time about our various extracurricular activities. Our tweets humble-brag about home-brewed beer, home-bred bees, and home-baked cookies. We hear tell at FLF of amateur tennis tournaments, family picnics, and puppies. And our Yammer feed last week featured an endless stream of unbearably adorable baby photos.

In fact, so rife is Viget with evidence of rich lives lived that we decided it was time for cold, hard data on the matter. After all, as Ovid once said, "In our leisure, we reveal what kind of people we are." What exactly do Vigets do with their spare time? (Besides win money on national television.) And what kind of people are we? We conducted a highly scientific survey about leisure activities pursued in the past three months (March, April, and May of 2013). Here are some of our groundbreaking discoveries.

Over half of Vigets did the following:

And exactly 61% of Vigets did each the following:

Perhaps most impressive for a digital agency, roughly the same number of Vigets have read fiction in the past three months (65%) as have played a video game (67%).

And it was heartening to learn that, while Vigets stay very, very busy during their time off, they also know how to take breaks:


Who would have guessed that 14% of Vigets have flown a kite in the past three months? Or that 20% of us have done a somersault? Or that 41% of us have spoken a language other than English? Or that 71% of us have woken up before 6am to make time for all these things?

Also noteworthy are these activities anonymously offered in the survey’s Comments section:

Noble pursuits, indeed.

In conclusion, as Abraham Lincoln once said, "I never did like to work, and I don't deny it. I'd rather read, tell stories, crack jokes, talk, laugh -- anything but work." Just kidding. We love our work. In fact, a few Vigets named pursuing personal web projects as a hobby, despite its overlap with their professional work. For many of us who are passionate about our work and industry, "work" inevitably bleeds across the "work-life" divide.

In conclusion, rather, we seem to have learned what we've known all along: Vigets make up an eclectic and talented bunch. As the proverb says, "All work and no play makes Jack a dull boy." Survey says… no dull Jacks or Jills around here.

Design Credit: Joseph Le.

Edit Your Corner Radiuses with this Photoshop Script

$
0
0

Rounded Rectangles

For the last couple of weeks, I’ve been using this script (h/t Mark) to accomplish something that I’ve wanted to do for quite a while: easily edit corner radiuses in Photoshop. Judging from the teaser preview of CS7, it appears that this type of funtionality will be included in the newest version, but in the meantime, this is a great add-on and will continue to be very useful for versions of Photoshop earlier than CS7. I’d recommend triggering the script with a shortcut key (I’ve got mine set to CMD + SHIFT + R).

Things You Can Do

  • Check the current radius of a rounded rectangle
  • Modify all the corners of a rectangle or rounded rectangle
  • Modify just one, two or three corners
  • Change the corners on multiple shape layers at once

Examples

Here are some quick examples of ways to use this script. I’m sure you’ll come up with many new ones on your own that fit your workflow.

Designing tabs → easily make your tab with certain corners at 90º.

Tabs


Change Multiple Shape Layers at once → you might select all your layers named “Button” and try out a different corner radius.

Buttons


Check the current radius → if you’re a FED or if you're working with someone else's designs, you can check containers, buttons, and other elements to see what their current corner radius is.


Icon Creation when working with an icon, you can modify the curve on the fly and try out variations without having to redraw the shape.

Icons


Correct your busted corner radiuses → if you change the dimensions of a rounded rectangle using the numbers at the top or with a simple Transform, the corner radiuses get stretched. Now you don’t have to worry about it and can quickly get your perfect rounded corners back. 

Busted Corners


I’ve just been using this radius resizer script but the same developer has come out with a new script that includes the ability to change the corner radius and also a number of other things. I haven’t used it much yet but plan to spend some time checking it out. In the meantime, happy corner radius tweaking.

Five Practical Uses for Dribbble for Designers

$
0
0

Dribbble. Maybe you love it; maybe you loathe it. Since its launch in 2009, it's become a popular way for designers to share peeks at what they're working on, or just promote their latest projects. Whether you think it's a good or bad thing for the design community, I wanted to share some of the aspects of the site that I've found useful, beyond just checking out others' work, stalking my favorite designers, and sharing my own work on occasion. You don't even need a coveted invite to take advantage of these Dribbble features.

1 - Find new and unusual color schemes

When you upload a shot, Dribbble automatically generates a color scheme from that shot. The results are often surprising. Dribbble picks up colors that aren't directly from the designer's exact color scheme. Or if the shot is a photo of a screen, or shows something like a table behind a printed design, it picks up those colors that are completely unrelated to the actual design. The result is unexpected color schemes that are often good starting points for branching out and creating your own surprising color schemes for a project.

2 - Find color schemes for a color you're not used to working with

Let's say you don't have the freedom to completely create a color scheme from scratch. The client already has a brand color you're working with. If that color is one you never work with, you might not immediately know how to best use it, or what colors to pair with it. You can search Dribbble by color, down to the exact HEX number, making it easy to see what other designers have done with that color, and quickly getting an idea of what other colors work and don't work with it.

3 - PSD autopsy

We've all spent a lot of time in Photoshop. A lot. Over the years we've developed our own methods and tricks for accomplishing what we want in it. Consequently, we've all developed our own blind spots in terms of some of Photoshop's features. One of the great things about working on a team with other designers at Viget is that I've often had a chance to work with another designer's PSD and learn how they use the program. A lot of designers on Dribbble attach PSDs with their shots, often as freebies for others who want to use their designs. I wouldn't suggest grabbing their UI designs and dragging them into your own comps. But if you see something you like and want to know how a designer achieved an aesthetic, it can be educational to crack open their PSD and find out what they did. Maybe they're using layer styles in ways you never thought of, or masks in a way you didn't know was possible.

4 - Refine your critiquing skills

Articulating constructive criticism is difficult. The most useful critique to receive identifies the problem with a design, why it's a problem, and offers the designer inspiration for fixing it, without dictating exactly what you think the solution is. Critiquing like this is a skill and takes practice. Designers often post their work on Dribbble because they want feedback and critique. By giving critique on shots, you're helping them out, and you're keeping your own articulation and critical thinking skills sharp. These are good skills to have, not only when critiquing others, but when discussing design with clients.

5 - Study processes

Studying processes over finished products has been a recurring theme with me this year. Because it is not a portfolio site, Dribbble is one of the best places to see the process designers go through, refining their work over time and incorporating feedback as a project progresses. Through projects and designers rebounding their own work, you can get an educational peek at what goes on behind the scenes that you probably won't see on a designer's polished portfolio piece.

What about you? Have you found Dribbble useful beyond being a place to look at cool work and to have your own cool work looked at?


More Dribbble Resources

Meet Viget’s 2013 Interns!

$
0
0

Summer officially started at Viget last week with the arrival of twelve interns ready to spend ten weeks walking our hallowed halls in all three locations, learning about our work and culture, creating new projects, competing for fabulous prizes, and revealing glimpses of the fun and action on their own internship blog.

And we have kept them busy from day one! Our interns had an intense first week full of activities: orientation sessions; introductions to the work and history of each lab; group project brainstorming and kick-off meetings; curriculum discussions with Advisors; and, of course, a chance to relax and get to know the rest of the Viget gang.

Their goals are ambitious. Their enthusiasm is palpable. We can’t wait to see what our interns learn and make this summer. And we’re thrilled to introduce them to you!

Falls Church Office

Erica Bond, Project Manager Intern

Una Kravets, Front-End Developer Intern

Jo Pang, User Experience Designer Intern

Jatin Sharma, Business Development Intern

Eli VanAlsburg, Designer Intern

Durham Office

Curt Arledge, User Experience Designer Intern

Corwin Harrell, Designer Intern

Sid Reddy, Rails Developer Intern

Jing Xiao, Front-End Developer Intern

Boulder Office

Will Gueble, Rails Developer Intern

Alex Martinez, User Experience Designer Intern

Samii Ruddy, Front-End Developer Intern


We're always on the lookout for future Viget interns. If you'd like to learn more about our internship program, check out our internship page or drop us a line at internships.va@viget.com.


Stay Curious

$
0
0

Over the past year, one thing has become abundantly clear to me. Design is super hard. Being brilliant and conjuring up creative solutions on demand is stressful work. Over time, the added challenge of tight schedules and limited budgets can eat away at your creativity and your enthusiasm to tackle bigger problems. So what to do?

Something Different

Assert control and seek out new experiences. This could be as simple as moving your desk or learning a new skill. But, as I discovered recently, I think it ideally means travel. The act of dropping your physical self in a completely unfamiliar and hopefully vibrant location can be an arresting and energizing experience.

For me, it was a trip to New York City a few weeks back. I was attending a conference, so I was naturally expected to interact with hundreds of new people all at once. To adhere to my itinerary, I also had to navigate the city streets and subway like a pro. And, of course, I was in New York, one of the most crowded and unforgiving cities (at least to tourists).

Heightened Awareness

The sum of an experience like this is a sense of heightened awareness, an acute sensitivity to everything around you. You are alone and vulnerable to some degree, so everything seems more interesting. Away from the routine of home, you notice everday things that previously went unnoticed.

Like the guy sitting in front of you in the conference audience. He's using some non-iPhone device, and swiping and tapping his screen at a blazing pace. He's using gestures you've never seen before. With a little more investigation, you discover he's holding a BlackBerry Z10 and the interface is, at the very least, refreshing. You thought BlackBerry was dead months ago.

Like the packed subway ride where you hear no less than three different languages in one trip. Like the side of some construction barricade that has layers of decomposing paper fliers that, when zoomed in, looks a lot like abstract art.

Questions

In the right state of mind, observation leads to questions. Like the fantastic High Line Park you stumble upon. How does such a crazy idea get built, and why don't similar re-purposed public green spaces exist in other cities? Or, what's the deal with the all those brightly colored, movable chairs scattered about New York? (Apparently, the chairs are not bolted down because people really like altering their environment when sitting in a public space.)

Stay Curious

Really, the sense of awareness and our tendency to ask questions are all about curiosity. Despite our best efforts, the inherit repetition and stress of work can grind away at these basic skills and, more importantly, our ability to be creative. To fight this battle, we must constantly look to cultivate a curious mindset, to see the interestingness all around us. And for a kick-start, don't forget the power of travel.

Viewing all 1271 articles
Browse latest View live